

Metrics
The Metrics tab shows how an instance is using its resources, live and over time.
Choose a Time Range
Pick 1H, 6H, 24H or 7D at the top right. 24H is the default. The page refreshes every 30 seconds.
The status next to the ranges tells you where the numbers come from:
- Live · updated with a time: the instance is running and the figures are current.
- Not running · history only: the instance is stopped, so only past samples are shown.
What You Can See
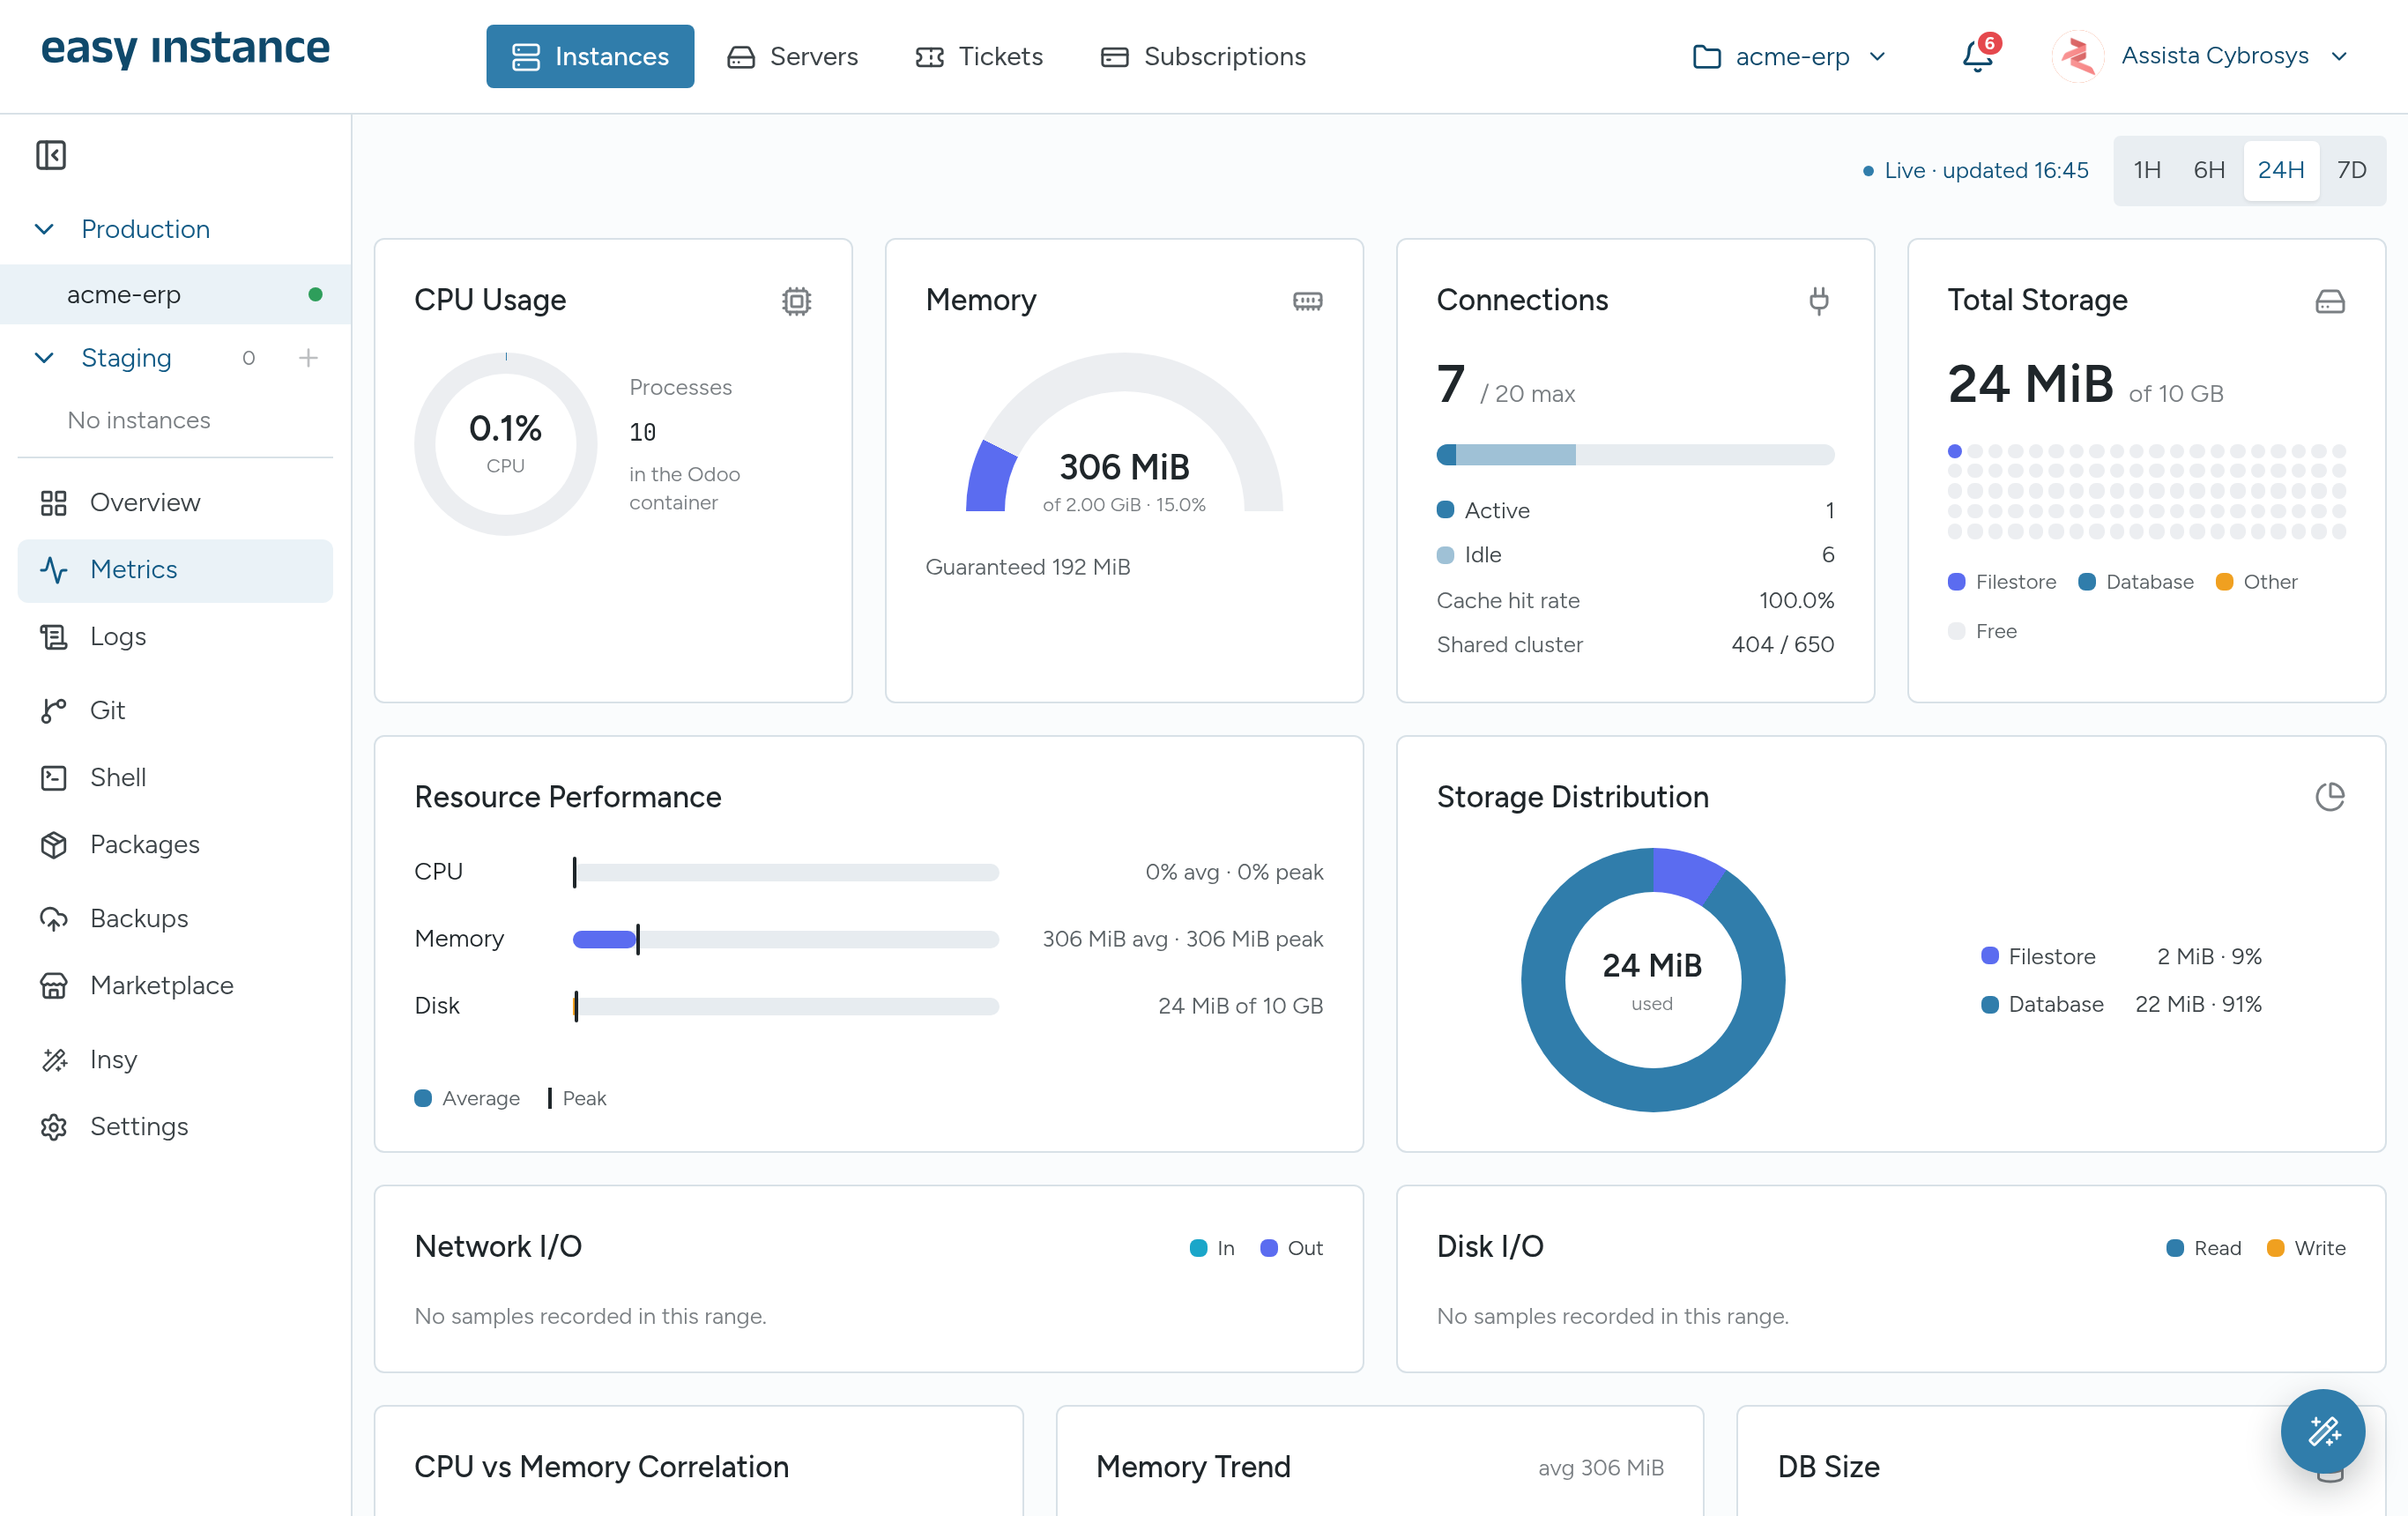
| Card | Shows |
|---|---|
| CPU Usage | Current CPU use and the number of processes in the Odoo container |
| Memory | Memory in use, the memory limit, and the guaranteed amount |
| Connections | Active and idle database connections, the connection limit and the cache hit rate |
| Total Storage | Space used out of your storage plan, split into filestore, database and other |
| Resource Performance | Average and peak CPU, memory and disk |
| Storage Distribution | Filestore and database sizes |
| Network I/O, Disk I/O | Traffic in and out, disk reads and writes |
| CPU vs Memory Correlation, Memory Trend, CPU History | How usage changes over the chosen range |
| DB Size | Database size over time |
| System Profile | Odoo version, stage, guaranteed CPU and memory, memory limit, storage plan, workers and creation date |
| User Map | Where your Odoo users are, from the country each user sets in their preferences |
Charts fill in as samples are taken, so a new instance shows No samples recorded in this range for a while.
When to Add Resources
If CPU or memory stays high, or storage is close to the plan, add workers or storage in Subscriptions and Billing.